This article is the second in a series about Agile Planning Circles, the way to drive strategic product development. The first, which is about the process, can be found here and should be read before this one to get the full benefit of the artifacts and tools layered on top of the process in this article.
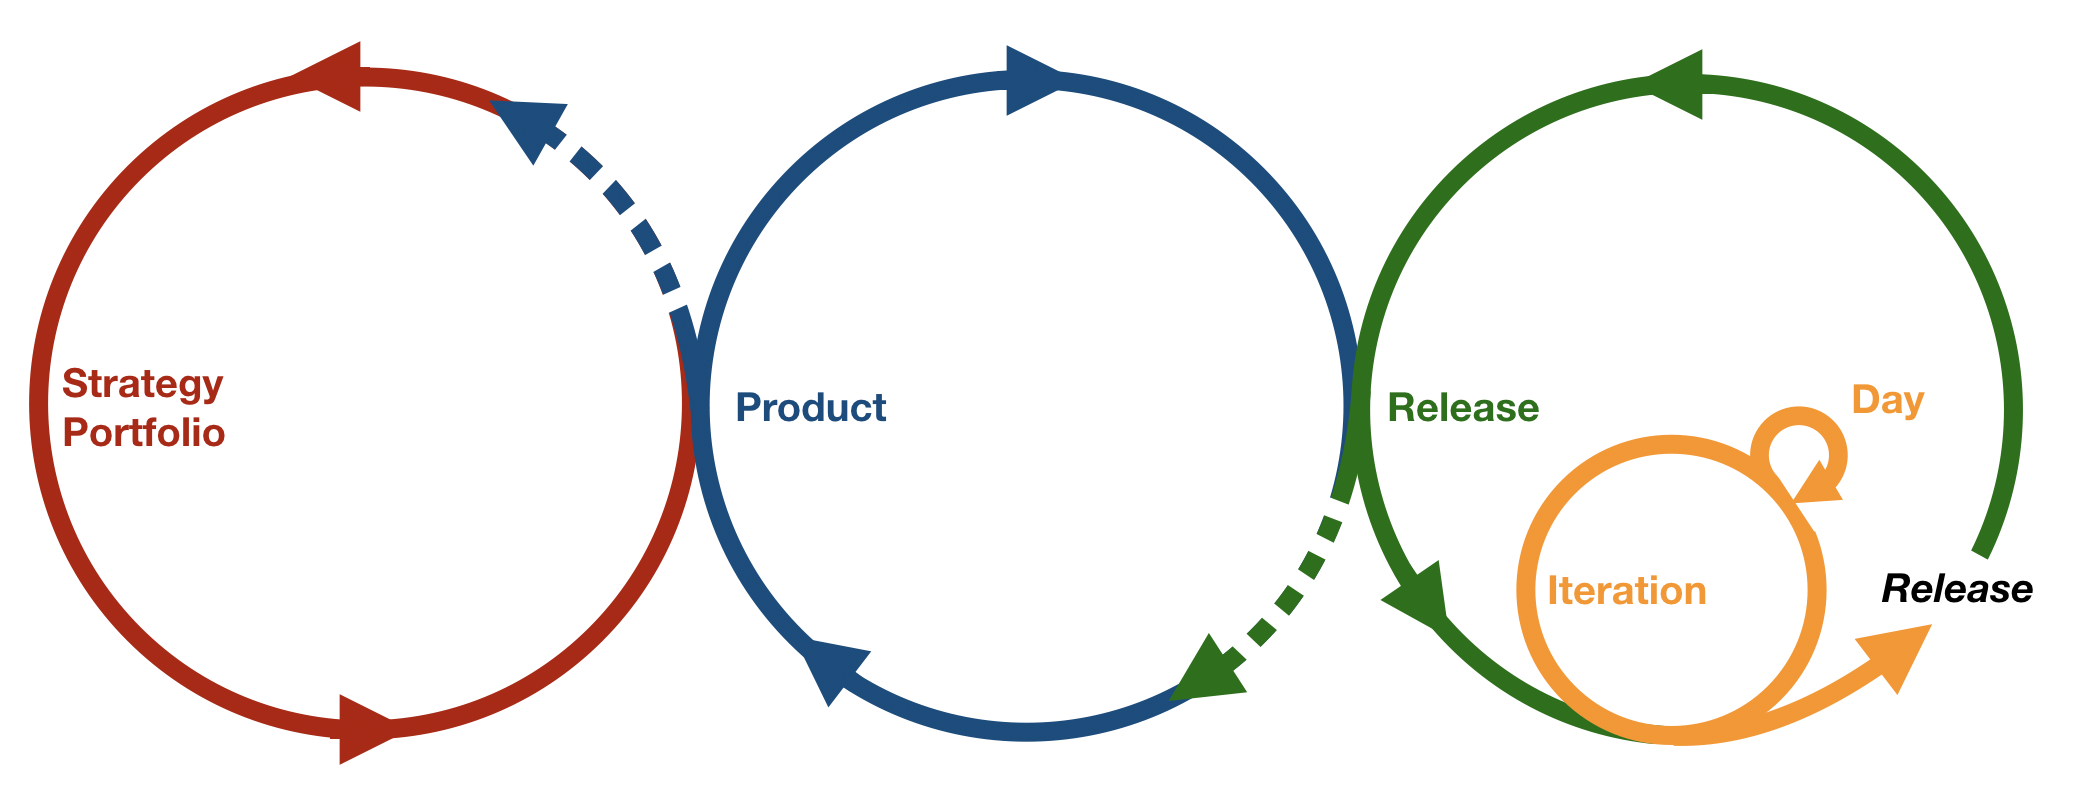
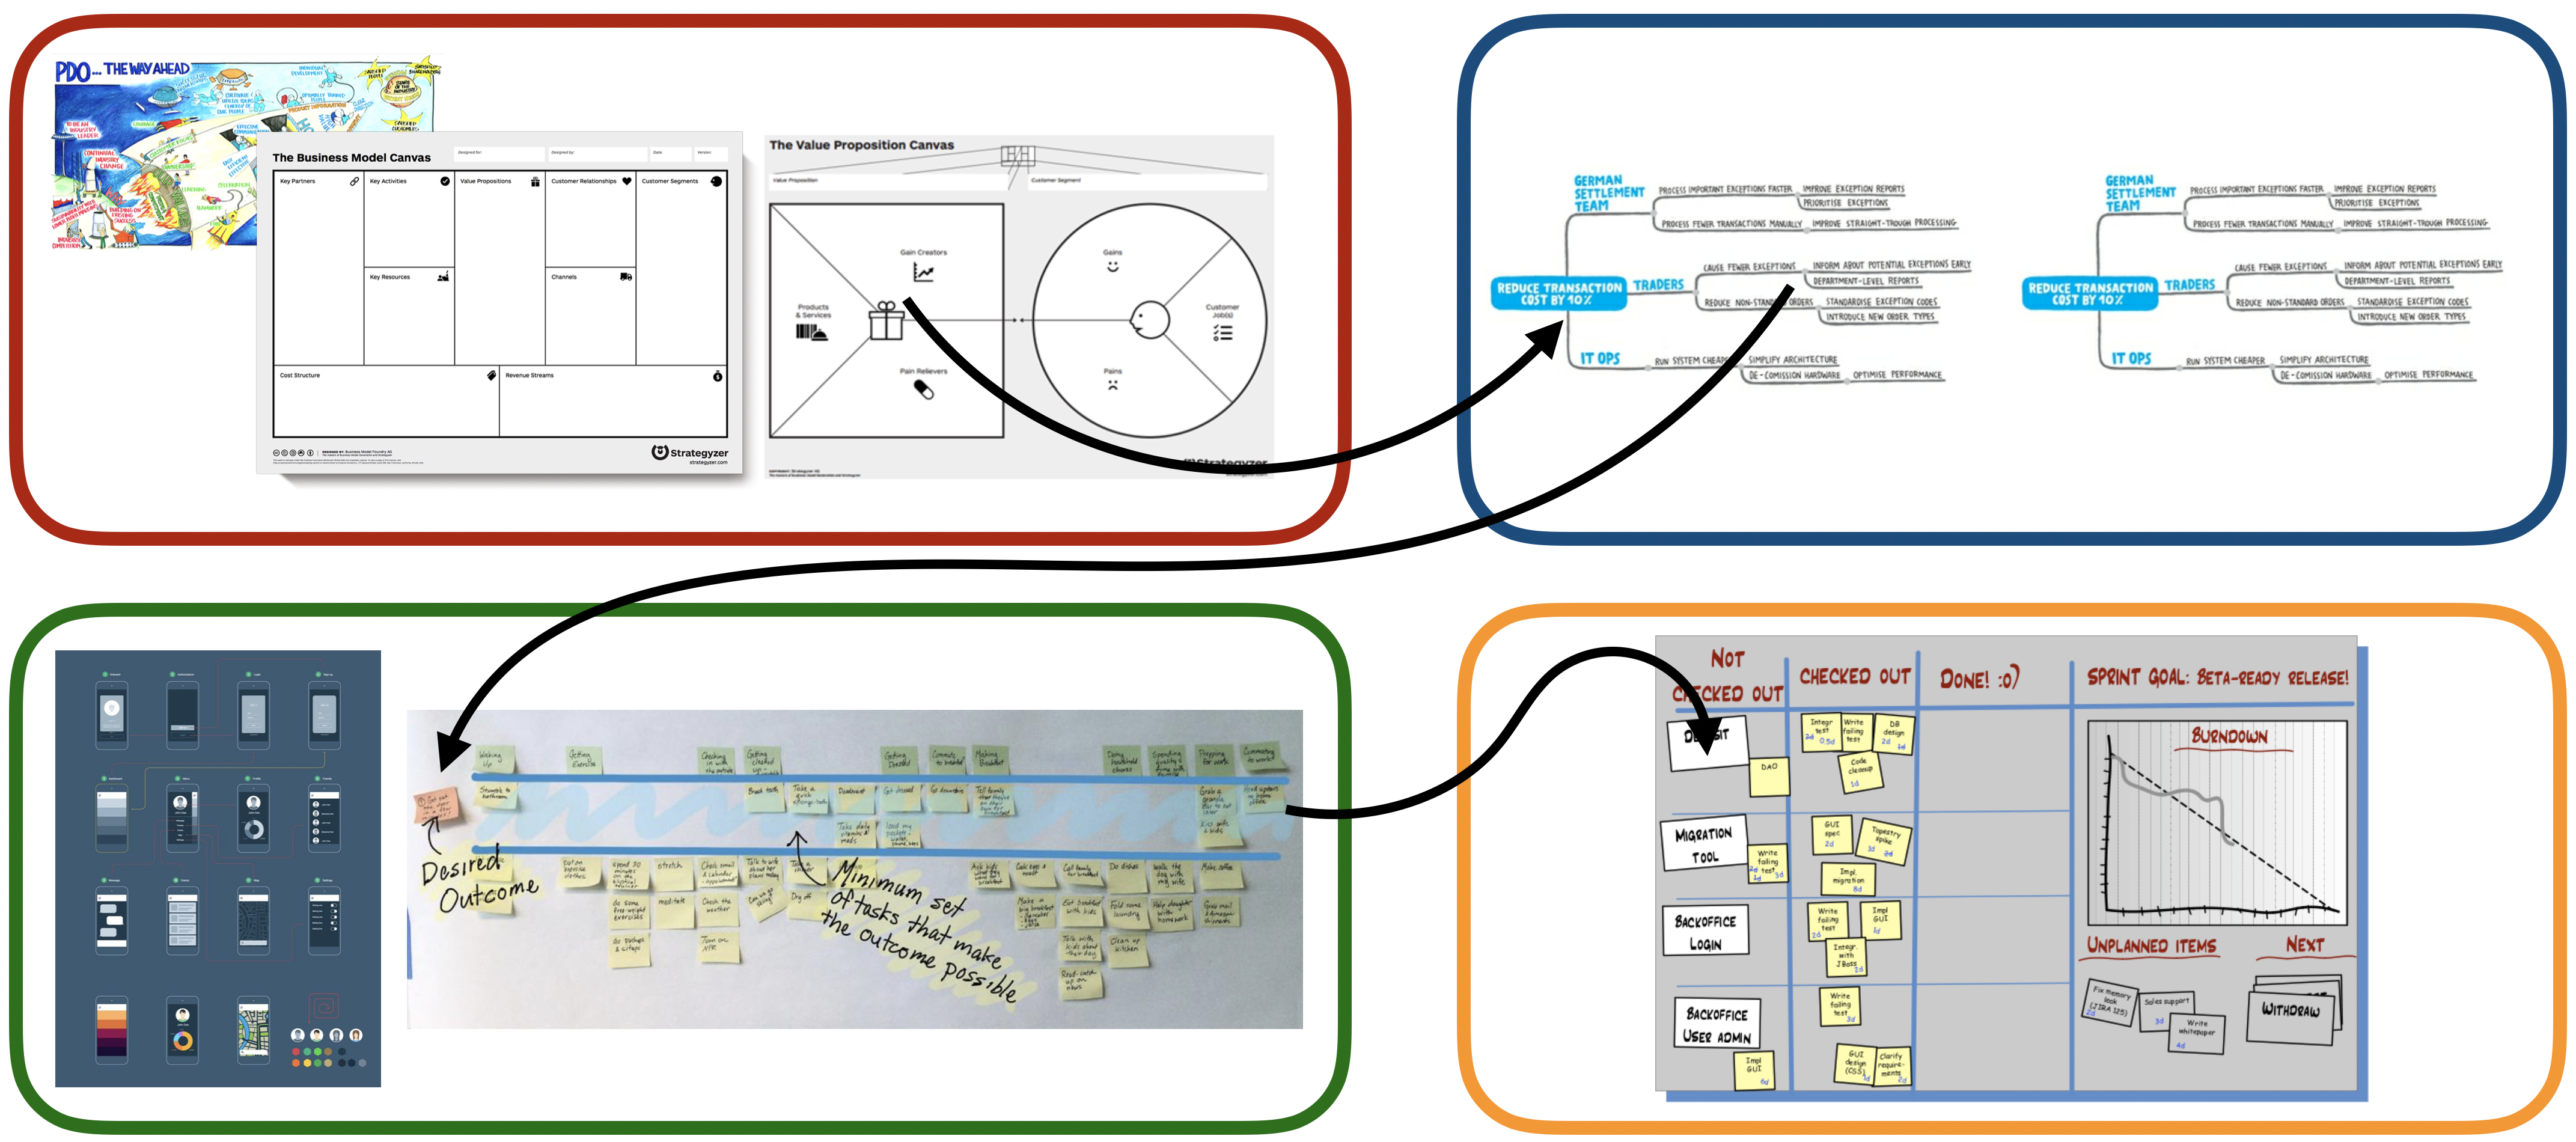
One of the basic ideas of Agile Planning Cycles is that decisions about future features should be made in a direct feedback loop with the users because only here maximum value with the least effort can be created. Since the Product Owner (PO) and the team(s) are there, they should be able drive the process from Strategy (the red circle above), through Design Thinking (the blue circle) and Lean Startup experimentation (the green circle) to release and the end of the Agile circle (orange).
The Product Backlog as a Collection of Artifacts
How can the PO/team be the driving force through all the circles? It is not enough to bring their long ordered Product Backlog into discussions with different stakeholders to stay aligned across the various abstractions of the future of the product from corporate strategy to detailed User Stories.
Hundreds of User Stories won’t focus a strategic discussion around the direction of the product, nor are they suited for discussing sources of value. But refined User Stories are absolutely necessary for the team to work effectively.
The PO/team needs several artifacts, each suited for a specific circle. However, I still perceive the set artifacts as the Product Backlog and events around them as refinement/planning, etc. In this article, I will present my favorite artifacts and how they tie together to support strategic product development.
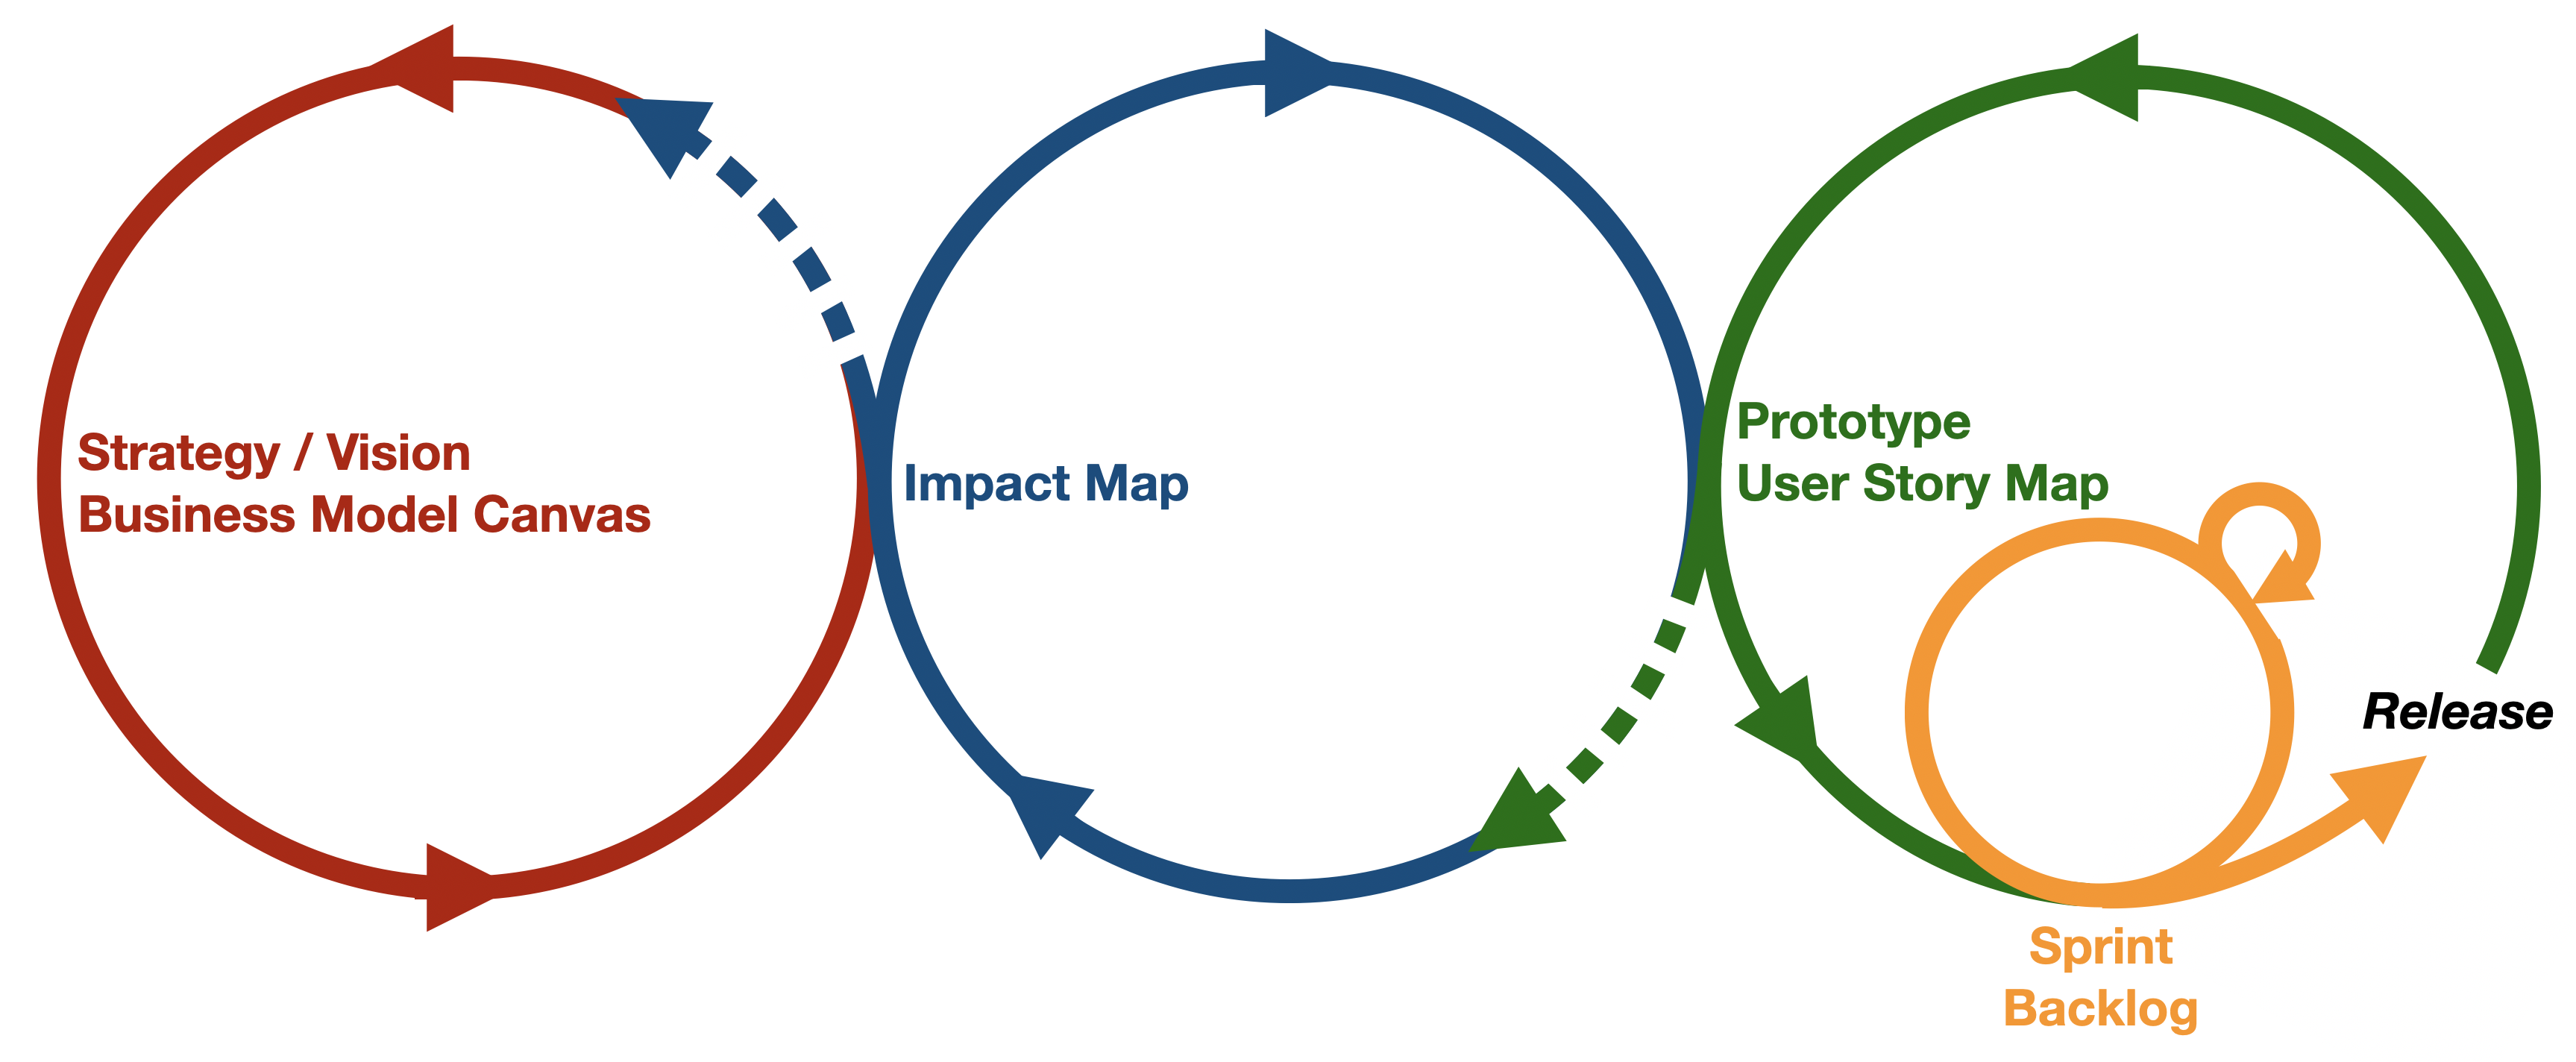
The artifacts are added to the Agile Planning Circles below. Let’s start from left to right.
The Strategy Circle
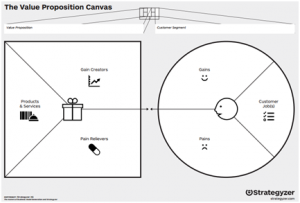
My f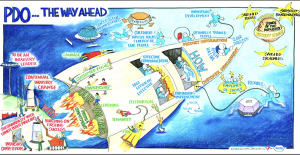 avorite artifacts in the Strategy circle are a Vision drawing (see the one by Patti Dobrowolski1 to the right), the Business Model Canvas2 and the Value Proposition Canvas3 by Alexander Osterwalder (also right), because they give a perfect
 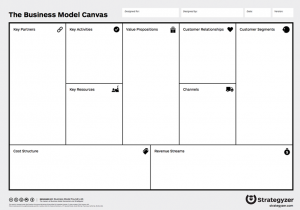 overview of the value that the product should deliver and are fitted for a strategic discussion.
The Vision and the two models give the team an understanding of the business model that they are part of, and they serve as support for creating the more detailed artifacts in a higher quality. The combination of the three also serves as a strong base for influencing strategic or portfolio discussions on a cross-organizational level.
The strategic artifacts are not as concrete and in any way ordered like a Product Backlog, but they are a necessary background to be able to set goals and prioritize. My favorite artifact to order the Product Backlog according to strategic objectives and the impact, we are searching for, is the Impact Map.
The Product Circle
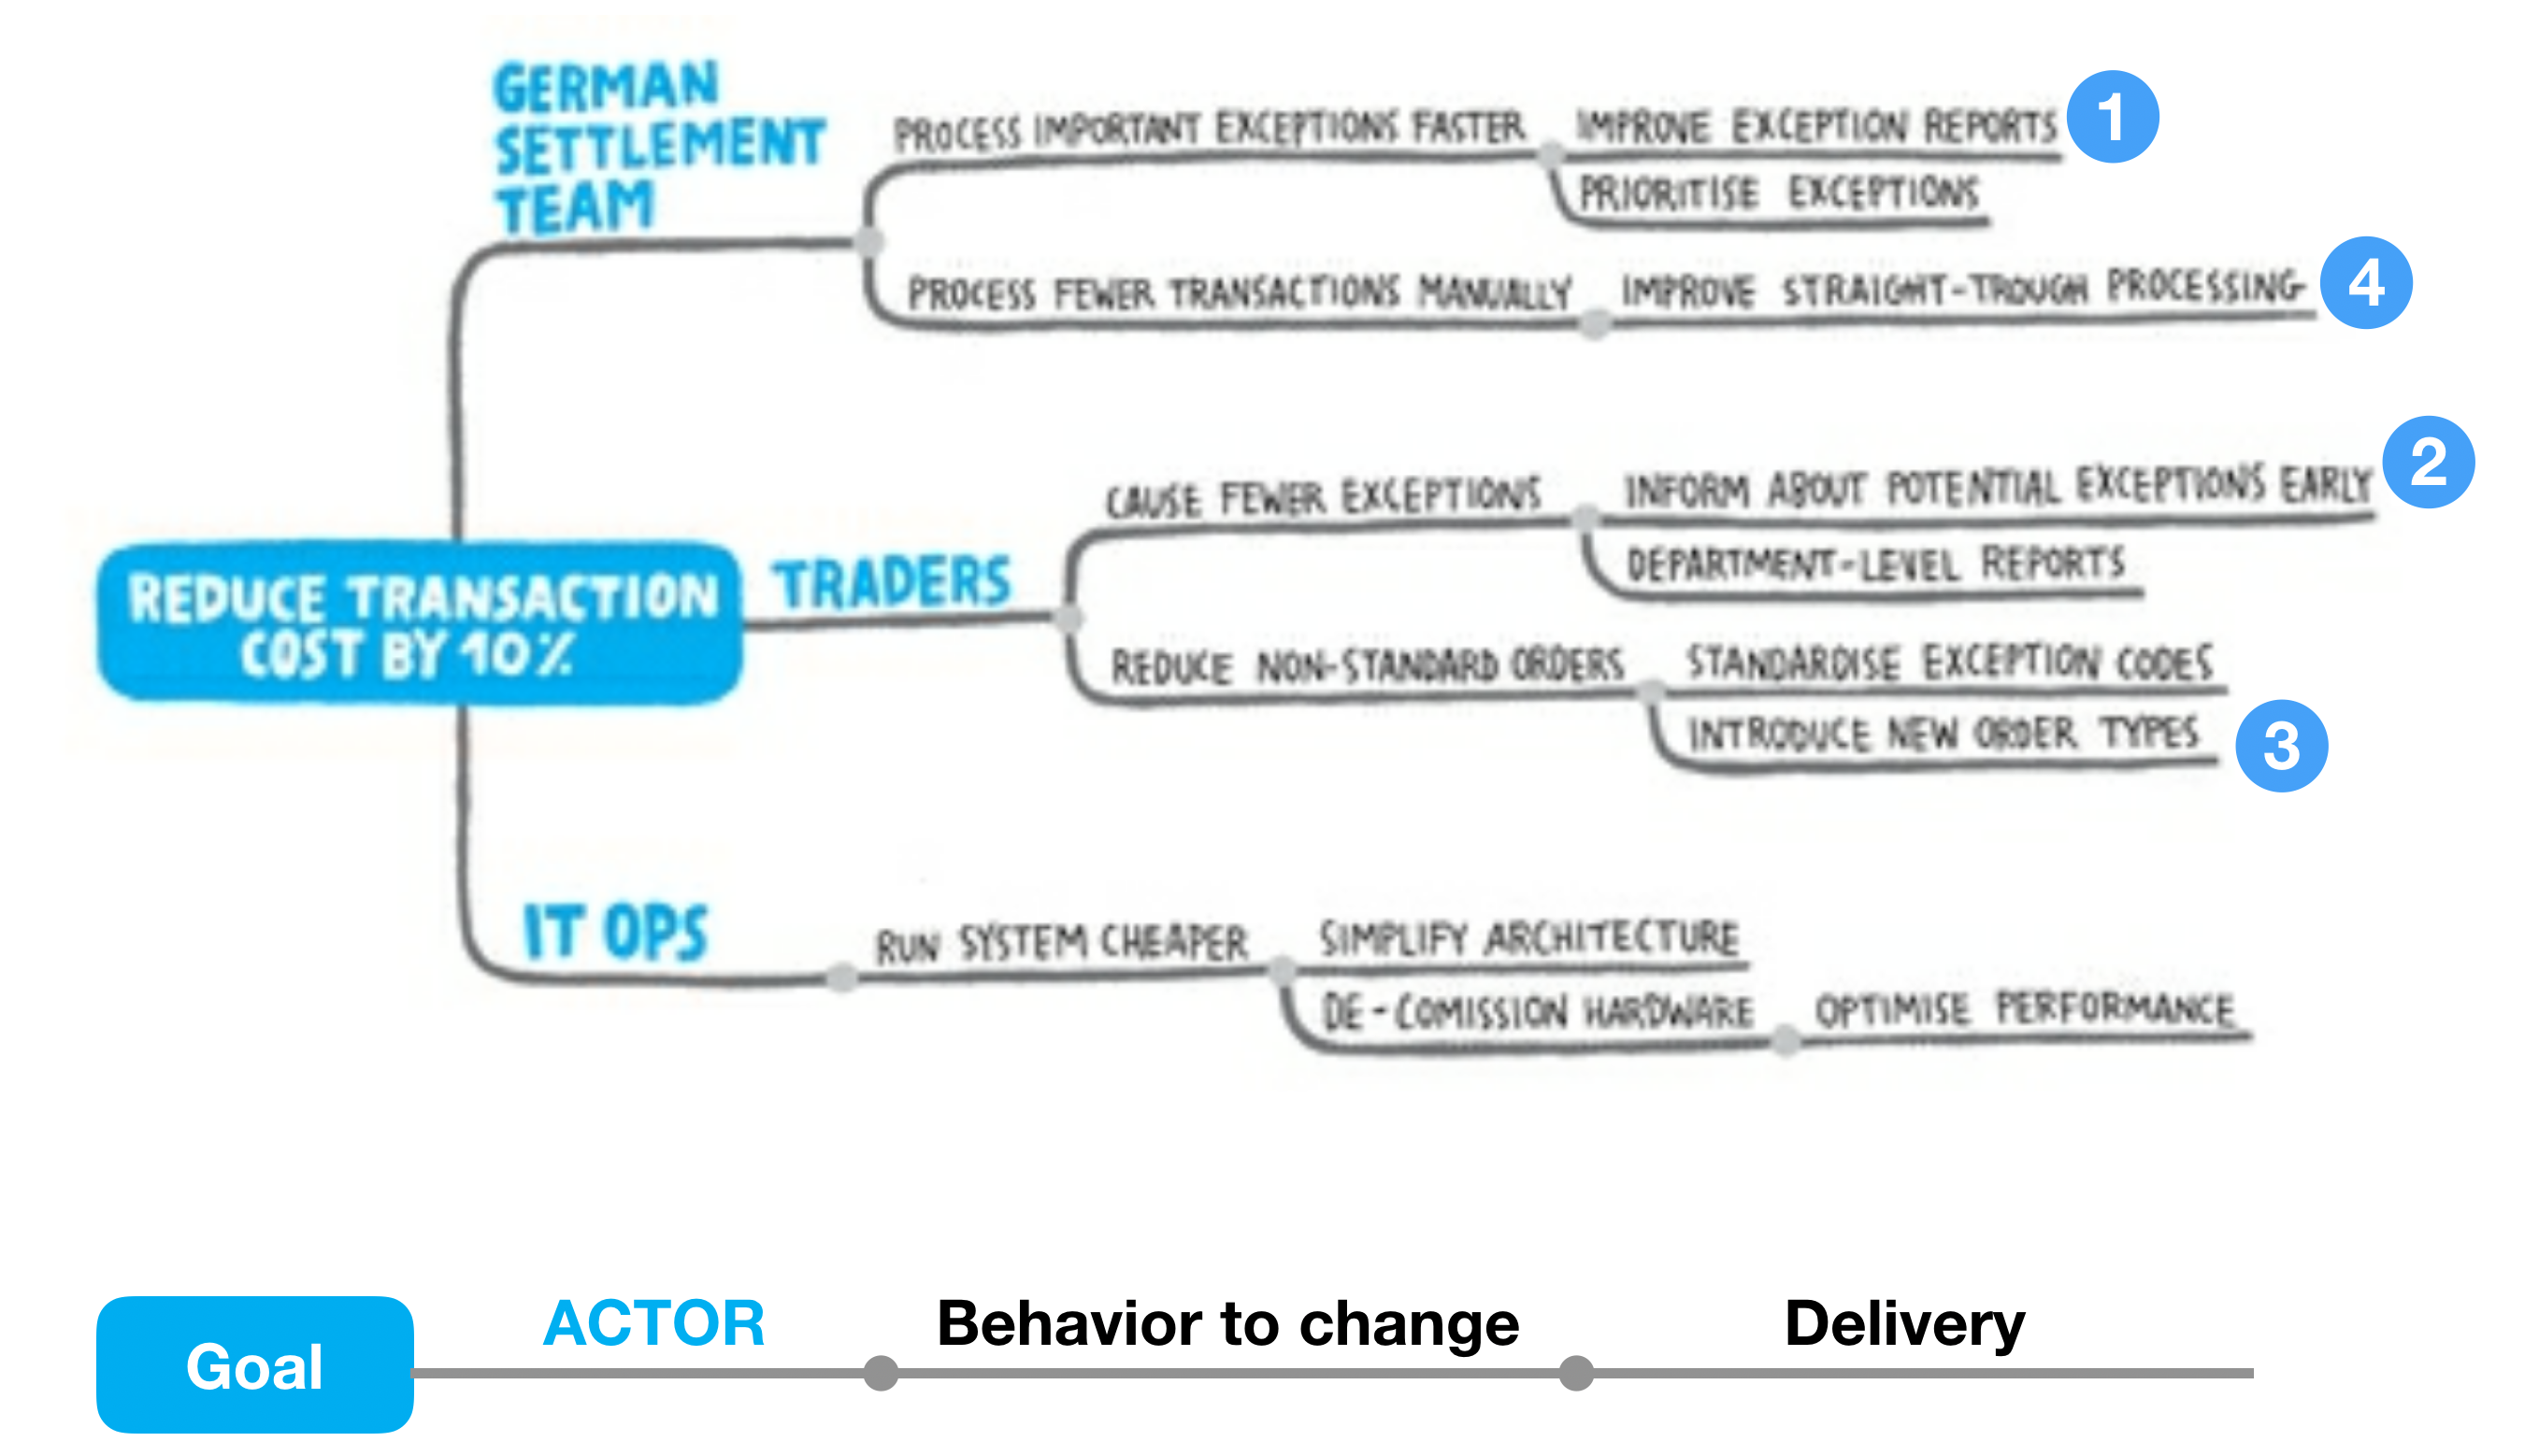
Impact mapping (see an example below) is a very visual way to map the strategic goals (the rounded blue square), via the actors who can produce/obstruct that result via a change in behavior (3rd column) to the actual deliverables (far right). Everything is, of course, assumptions, but being explicit about possible hypotheses eases the collaboration around which one to test next. A Design Sprint will typically find a specific solution for changing behavior for a particular actor. An example hypothesis from the upper line in the figure:
We believe that improving exception reports for the German settlement team will reduce transaction costs. We know that is true when they process important exceptions faster.
Usually an Impact Map contains several strategic goals, so you’ll have several diagrams like the one above, and I like to ease navigation of the Impact Map by loosely estimating the potential value (in cash) of each goal and how it is distributed on the different actors – and if possible even to the behavior change. I like to make the value explicit for two reasons: To force ourselves to be precise in our discussions around different options and to validate that we can create measurements that can guide us in our search for value. Labeling the hypotheses in the order, we like to pursue them; we have what corresponds to the non-refined Product Backlog Items (PBIs) in the Product Backlog.
As opposed to a simple ordered backlog of deliveries, we have a map of all the hypotheses; we have about creating the desired value. We will never deliver all of them, and we don’t know yet which ones are going to give us the value. The Impact Map makes it a lot more accessible for the stakeholders to collaborate in this search.
The Impact Map was introduced by Gojko Adzic. Read the book4 and watch this video5 and understand deeper why a map is perfect for maximizing value.
The Release Circle
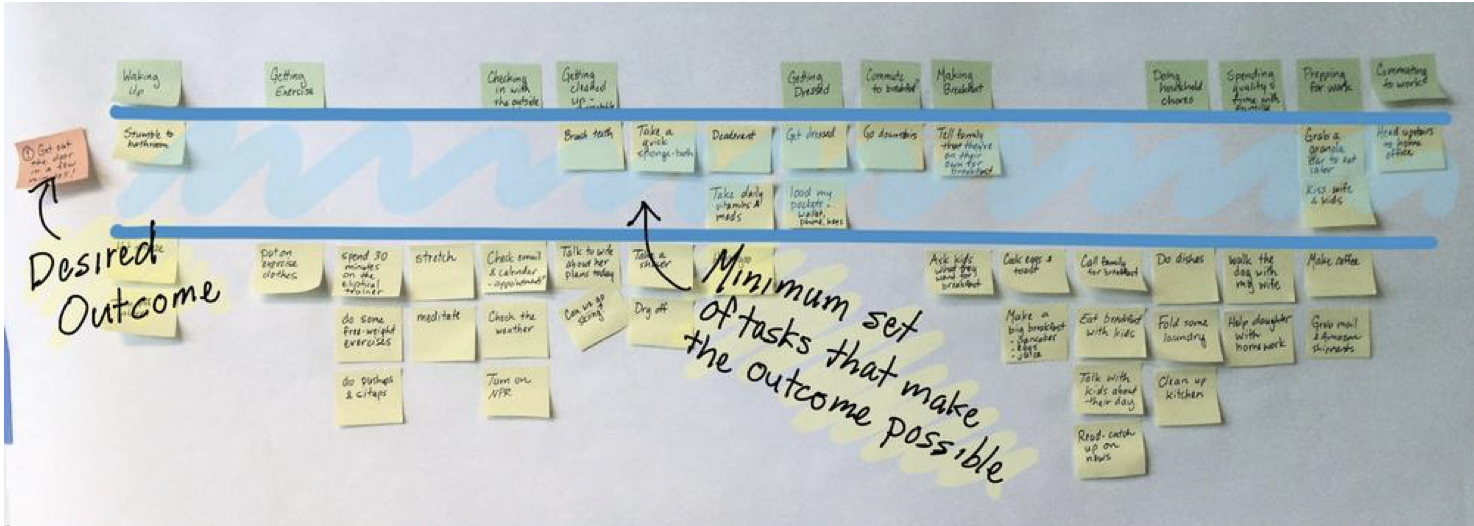
From the Impact Map hypotheses are pulled one at a time into the Design Thinking circle to run a Design Sprint. In just five days, the hypothesis is transformed into a tested prototype, as mentioned. The result goes into the Release circle (green), where User Story Mapping is used to create an overview of what is delivered over the next sprints. User Story Mapping is developed by Jeff Patton6. Another must-read book.
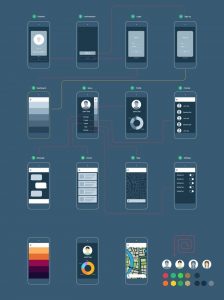 The result of User Story Mapping, the User Story Map (depicted above) provides a two-dimensional view on the next items in the Product Backlog sliced in minimum releases. It is not the goal to deliver every item on the map; it is to achieve the desired outcome with minimum effort. The upper lane of the User Story Map will be the content of the next Release circle, and for each release, User Stories are moved up in the search to achieve the desired outcome. The thinner slice in each release, the better, because each slice provides feedback and new learning about the user.
When the desired outcome is achieved, the remaining User Stories can be discarded, and a new Story Map should be populated. The discarded User Stories are effort saved because you made the impact without having to invest in them.
The User Story Map is the primary artifact to guide the Release circle just like the Impact Map guides the Product circle, and it ensures easier collaboration around delivering maximum value with as little effort as possible.
The Iterations Circle
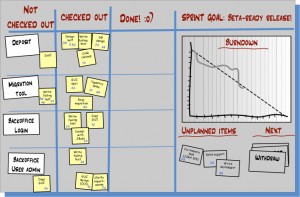 The artifact of the Iteration circle, the Sprint Backlog (figure to the right) is, of course, the most detailed, since we are working on them right now. It is easy to collaborate around for the duration of the Sprint to create a release.
Now that all the parts have been presented let’s see how items flow across them as the team moves around the Agile Planning Circles.
The Whole Product Backlog
Instead of having one ordered list of your PBIs, I suggest that you have three different views + The Sprint Backlog, and use those depending on in which of the Agile Planning Circles the team is. The movement across the artifacts happens by PULL, i.e.:
- When an Iteration ends a new Sprint backlog is pulled from the top slice of the …
- Story Map, and when the hypothesis is tested with success or failure, the Story Map is cleared, and a new Design Sprint will fill it again. The topic of the Design Sprint is pulled as the most valuable hypothesis on the …
- Impact Map, which calls for an update when a change of direction is needed. That triggers an iteration in the Strategic circle, which updates …
- Vision and canvases as input to a new/updated Impact Map
Imagine how you as a team can stand in front of a wall looking like below, where you easily can change your level of abstraction and discuss the future of your product together and with a stakeholder who passes by.
The arrows on the illustration show how the strategic product position is mapped to goals on the Impact Map; how the hypotheses on the Impact Map are mapped to the User Story Map; and how each slice on the User Story Map is moved to the Scrum Board and finally released to users. This is very simplistic – in real life, the sequence looks more like described in the previous article and all the artifacts will anytime independently of this be discussed with stakeholders and might be changed based on that. Of course, also the users feedback on releases might continuously influence any artifact. However, the arrows show the general flow of Product Backlog items.
This overview completes the description of Agile Planning Circles: process and artifacts. There are more details to this, and I will return where you found this article touching on the topics below:
- measurement for instant feedback on impact/value creation
- scaling to several teams
- is the PO role more like a Product Manager?
- etc.
- Patti Dobrowolski: https://www.youtube.com/watch?v=zESeeaFDVSw
- Alexander Osterwalder: Business Model Generation https://www.amazon.com/Business-Model-Generation-Visionaries-Challengers/dp/0470876417/
- Alexander Osterwalder: Value Proposition Design https://www.amazon.com/Value-Proposition-Design-Customers-Strategyzer/dp/1118968050/
- Gojko Adzic : Impact Mapping. Making a Big Impact With Software Products and Projects. https://www.amazon.com/Impact-Mapping-software-products-projects-ebook/dp/B009KWDKVA/
- Gojko Adic : Make Impacts, Not Software (1 hour) https://vimeo.com/68327406
- Jeff Patton : User Story Mapping: Discover the Whole Story, Build the Right Product. https://www.amazon.com/User-Story-Mapping-Discover-Product/dp/1491904909

Very interesting series, thank you.
I am still struggling about how to do something easier but still meaningful at management level (instead of BM canvas / VP canvas that tend to look like consultants stuffs, especially for very pragmatic leaders). If you have an idea…
Looking forward to your posts about “measurement for instant feedback on impact/value creation” and “is the PO role more like a Product Manager?”, among others.
(Btw, the link at the bottom of the first article is broken).
Thanks for your comment. Promise to carry on.
I my experience pragmatic leaders should not be presented models, they should be involved. So even if I’ve made BM/VP or drawn a vision with other stakeholders, I usually start all over with a new group. When they have made their version, I let them compare with other stakeholders results.
What artifacts are included in the circle?
Take a look at the second version of the circle, there they are written in the same color as the circles